Most retrieval systems treat the web as a bag: documents come back in a list, the good ones go to a model, the structure connecting them thrown away. Caesar, the research agent I work on, keeps it: as it explores it builds a graph, pages as nodes and followed links as edges, and writes its notes conditioned on that local structure, what a page says read against what its neighbours say.
That is not an interpretation, it is code. The note-taking prompt carries a
block headed RELATED INSIGHTS OF NEIGHBORING PAGES, every entry stamped with
its hop distance. “Neighbouring” is generous: it reaches three hops out and
holds up to 24 entries, beside a second block of up to eight pages of traversal
history, which every page gets regardless of position. So a well-connected page
fills the block and a dead end does not. But a dead end is not writing blind:
the link that led there is in the graph before the notes are written, so a leaf
inherits whatever its one neighbour could see. Does that difference do any work?
What was actually measured
Take five finished explorations, one for each of the five challenges we evaluate on, rank each final graph’s pages by neighbour count, and take two groups:
- Hubs: the ten most-connected pages the agent visited more than once. Across these five graphs they have 5 to 36 neighbours and were visited 3 to 45 times.
- Leaves: the ten least-connected pages the agent visited exactly once. Every one has a single neighbour: reached once, never returned to.
Concatenate each group’s notes into one file: two files per challenge, ten sets of notes apiece, each about 5,000 to 5,800 words, the leaf file longer on three of the five, so neither side wins on length. Then hand both to three LLM judges, five trials each, on our usual rubric: how new, how useful, how surprising, one to ten each, thirty in total.
One thing I need to be exact about, because the first version of this post said
otherwise: there is no second writing step. The artifact scored is the raw pile
of notes, concatenated, opening with the literal string Insights:. Two piles
of notes were compared, not two written answers, a narrower thing to have
measured.
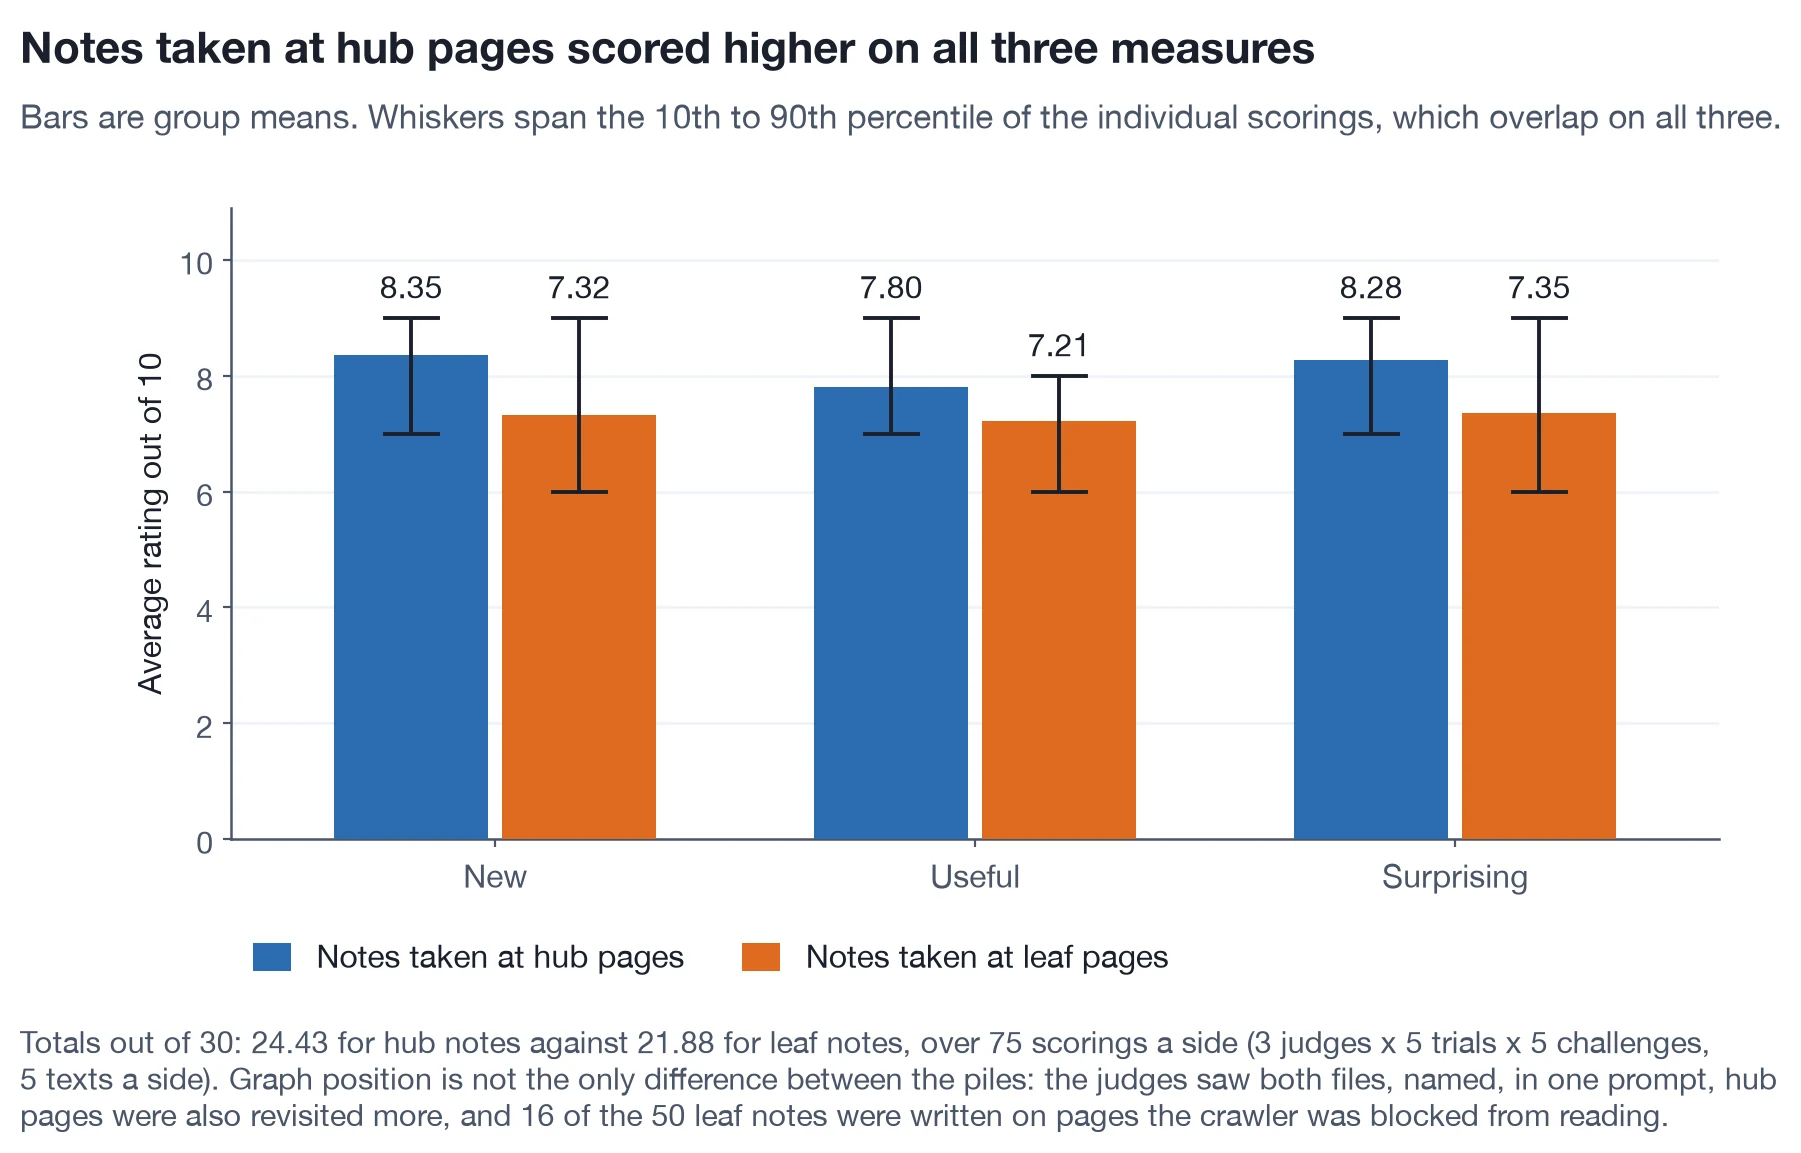
Hub notes scored higher
| Hub notes | Leaf notes | |
|---|---|---|
| New | 8.35 | 7.32 |
| Useful | 7.80 | 7.21 |
| Surprising | 8.28 | 7.35 |
| Total | 24.43 | 21.88 |
Hub notes lead on all three dimensions pooled and on total score in all five challenges. Two of the fifteen per-challenge dimensions break the pattern: on the open-ended challenge leaf notes lead on Useful, 7.87 to 7.67, and on cross-domain synthesis they tie there at 7.67.
Two units, two effect sizes
The effect size we report is Cliff’s delta, which asks how often a draw from one group lands above a draw from the other.
The Caesar paper’s unit is the challenge, five of them. Averaged within a challenge, hub notes scored 25.07, 23.93, 25.07, 24.40 and 23.67; leaf notes 20.87, 21.33, 22.27, 21.47 and 23.47. The lowest hub mean sits above the highest leaf mean, the condition the paper’s Table 1 caption calls strict dominance, and what makes delta = 1.00, a statement about five numbers against five numbers.
Drop to individual scorings, 75 a side, and the picture is murkier. Pick one hub scoring and one leaf scoring at random: the hub one is higher 73% of the time, lower 19%, tied 8%. Cliff’s delta over those pairings is 0.54. Hub scores run from 18 to 29 out of 30, leaf scores from 15 to 28, distributions that overlap heavily.
Both numbers are true, in their own units. The first version of this post quoted the 1.00 and glossed it as the second: pick any hub-sourced item and any leaf-sourced item and the hub one wins, every time. That is false. Close to one pairing in five goes the other way.
The margin is not uniform either. On four of the five challenges hub notes lead by 2.6 to 4.2 points. On the fifth, the open-ended one, the gap is 23.67 against 23.47, which is nothing. Strict dominance at n = 5 holds, by two tenths of a point.
The analysis script reports a Mann-Whitney U test on the 150 rows, p = 8.3e-09. I would not lean on it: it treats 75 scorings a side as 75 independent samples, and they are three judges scoring five texts, five times each.
Strict dominance does not replicate
The same comparison was run over a second set of explorations, and this is the part I should have led with: it is the only replication I have. Those used the older note-taking prompt, one hop of neighbours and no traversal history; other config knobs differ too, so it is not a clean ablation, but the prompt is the difference that matters here. It was judged twice: three judges by three trials gave 23.29 against 21.76 over 45 scorings a side, and a second pass on the identical three-by-five design, run minutes before the main one, gave 23.49 against 22.17 over 75.
Both point the same way, both less emphatically. In both, one of the five challenges reverses, counterfactual reasoning, where the leaf pile wins. So the strict dominance behind delta = 1.00 does not replicate: the challenge-level delta is 0.92 on the first pass and 0.52 on the second, against 1.00 above, and the scoring-level delta is 0.33 and 0.30 against 0.54. Consistency across all five challenges is the whole basis for the 1.00, and the part that fails when I run it again.
Four reasons to discount this
The scoring was not blind. This is the one that bothers me. The judging
harness pastes each answer under a header containing the filename,
answer_cat_hubs.txt and answer_cat_leaves.txt, both in the same prompt. So
the judges saw the two piles side by side, told by name which was which. “Hubs”
and “leaves” are not neutral words, and a judge with any prior about graph
structure has been handed the answer. I cannot rule out that the labels account
for the entire gap, and I have not re-run the panel with the files renamed.
Everywhere this post says hub notes scored higher, read it as higher under a
panel that could see the condition labels.
A third of the leaf notes are about pages the agent never got to read. I eventually read the two piles, not just the score tables. Sixteen of the fifty leaf entries are the model writing about a bot check: a Cloudflare interstitial, a redirect, an access gate. One calls the page “a barricade, not information.” Another observes that “the artifact here is absence.” One of the fifty hub entries is like this, and the sixteen are not spread evenly. On the constrained challenge nine of ten leaf notes are about pages that would not load, and that is the challenge with the largest gap, 4.20 points; on counterfactual reasoning it is six of ten; on the other three, one between them, and across those three the gap is 1.98 points rather than 2.55. Worse, the selection rule causes this: a page that answers with a bot check offers no links worth following and no reason to come back, so it settles with one neighbour and one visit, exactly the definition of a leaf. Some unknown share of this result is readable pages beating unreadable ones.
Hubs were revisited and leaves were not. The selection rule asks for a visit count above one on the hub side and exactly one on the leaf side, and Caesar rewrites a page’s notes every time it returns, with the previous notes in context, so the hub pile has had more revision passes, in one case 45. Position and processing are confounded by construction, and some of what I want to attribute to position is probably just rework.
Hubs may simply be better pages. Well-connected pages tend to be surveys, overviews and canonical references, and notes from a good survey beat notes from a dead end. If that is the whole story the finding reduces to “read better sources,” which nobody needs a graph to discover. Separating “hubs are better pages” from “hubs are better vantage points” needs a design this study does not have: the same page read with neighbour context and without. I have not run it.
What is left
Stated at the width the evidence supports: notes harvested at well-connected pages scored higher than notes from dead ends, 24.43 against 21.88 on a 30-point rubric, on all three dimensions pooled and on total score in all five challenges, under a non-blind LLM panel, on a leaf sample where a third of the notes were taken on pages that would not load, and with the five-for-five part failing to reproduce on the one other set of explorations I tried.
That is a smaller claim than I started with, and still worth having. The agent gathers more material than fits into a synthesis prompt, so something must choose what goes in, and the default is recency or retrieval score. Graph position is a cheap selection signal, free to anything that crawls before it writes, and here it did some work even on the most deflationary reading, where connectivity is mostly a proxy for the page having loaded and been worth returning to.
The mechanism I would like to be true, that a hub is a better vantage point rather than a better page, is a hypothesis this experiment cannot settle. Whether position carries more than “surveys are good pages,” or more than “that one came back a 403,” is open, and I would rather leave it open than close it with the experiment I have.