The previous post was about what happens when you let language models grade research answers, and about catching one of our judges favouring its own model family by a raw 1.35 points.
The next question is whether the judges were right at all. So we asked people.
The setup
Each rater judged up to five head-to-head pairs, one per research challenge: an answer from Caesar, our research agent, against one from Gemini 3 Deep Research, the strongest baseline and second-best system on the automated evaluation. Blind to which was which, they picked the more creative under the same rubric the AI judges used: New, Useful and Surprising, the three axes summing to the 30-point total quoted below.
112 comparisons in total. There are only five distinct pairs, so the 112 votes are roughly 22 looks at each of the same five items. Our paper reports 23 raters; the vote table behind it carries 21 distinct rater names across 23 sittings, two people having submitted twice. Seven of the 112 votes repeat a pair the same rater had already judged, and one of those repeats came back with the opposite answer.
The raters also did not see the answers as written. Both first went through the same LLM normalization step, which rewrites each into a fixed two-paragraph schema: a 2 to 3 sentence plain-language summary of the core idea, then a 3 to 4 sentence argument for why it is creative. Roughly six sentences a side. The paper’s reason is a good one: the format was designed to let raters “quickly judge the underlying idea while not getting distracted by surface verbosity or structure.”
That compresses length without equalising it. Across the five pairs our normalized summary was the longer one every time, by 5 to 42 words, about 16% on average. If the raters were rewarding length they did it badly: the pair where ours ran 42 words longer is one of the two we lost, and the pair where it ran just 5 words longer is one we won.
56.25%, and the machine verdict
Our agent won 63 of 112, which is 56.25%. The paper calls that an odds ratio of 1.29; it is really the odds, 63 to 49. The 95% interval around the share runs from 47% to 66%, so it still spans 50%: this sample does not rule out a coin flip. And that is the generous interval, because it treats the 112 votes as 112 independent trials when they are 21 people voting on five items.
Set that next to the machine verdict. On the automated evaluation our agent beat the runner-up by 3.18 points on a 30-point scale, with effect sizes uniformly large: Cliff’s delta of at least 0.76, against a 0.47 threshold for “large.” That 0.76 is the minimum across every baseline and answer format, so it is not the number to set beside the human study. For the raters’ pairing, on full answers, the delta was 0.84.
Cliff’s delta is worth two sentences: the unit it is computed at is easy to get wrong, and we have gotten it wrong before. It runs over the five challenges, on the mean score each produced: pick a Caesar challenge mean and a competitor’s at random, how much more often is the Caesar one higher? A delta of 1.00 is strict dominance at that unit, which would mean Caesar’s worst challenge mean sat above the competitor’s best, not a claim that every individual Caesar answer beat every competing answer. At the level of individual scores the two distributions overlap.
The paper reports no p-values, and we should be careful how we say that. Mann-Whitney U was computed and the run artifacts carry the statistic, at a different unit again: across the 45 individual judge scores each system received in a format, not the five challenge means the delta uses. What we chose to publish was the effect size, “aligned with our magnitude-of-difference framing rather than null-hypothesis testing,” with the deltas presented as “estimates of stochastic dominance rather than p-values.” Stochastic dominance is what Cliff’s delta measures. The question we answered in print was how big the gap is, not whether it is distinguishable from zero: a framing decision, fair to argue with, but not an absence of the test.
By that measure it was not close.
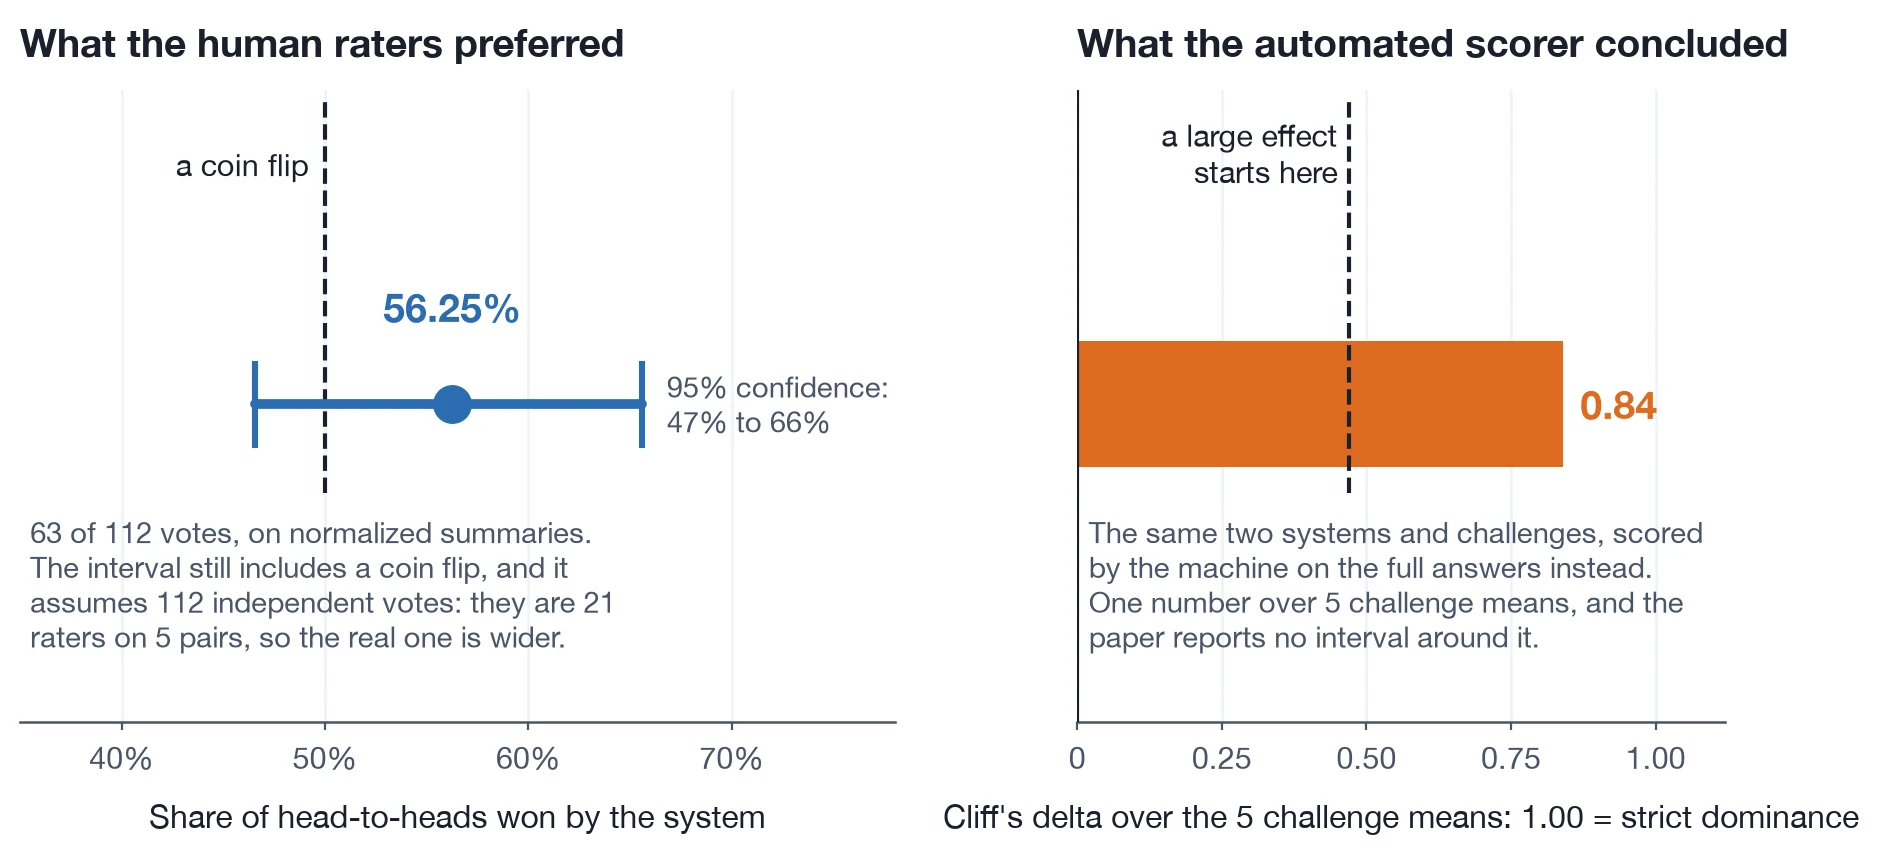
The humans said: slightly better than a coin flip.
The 56% hides a split
Underneath the aggregate, the raters were not mildly in favour of anything. They were emphatic in both directions, depending on the challenge.
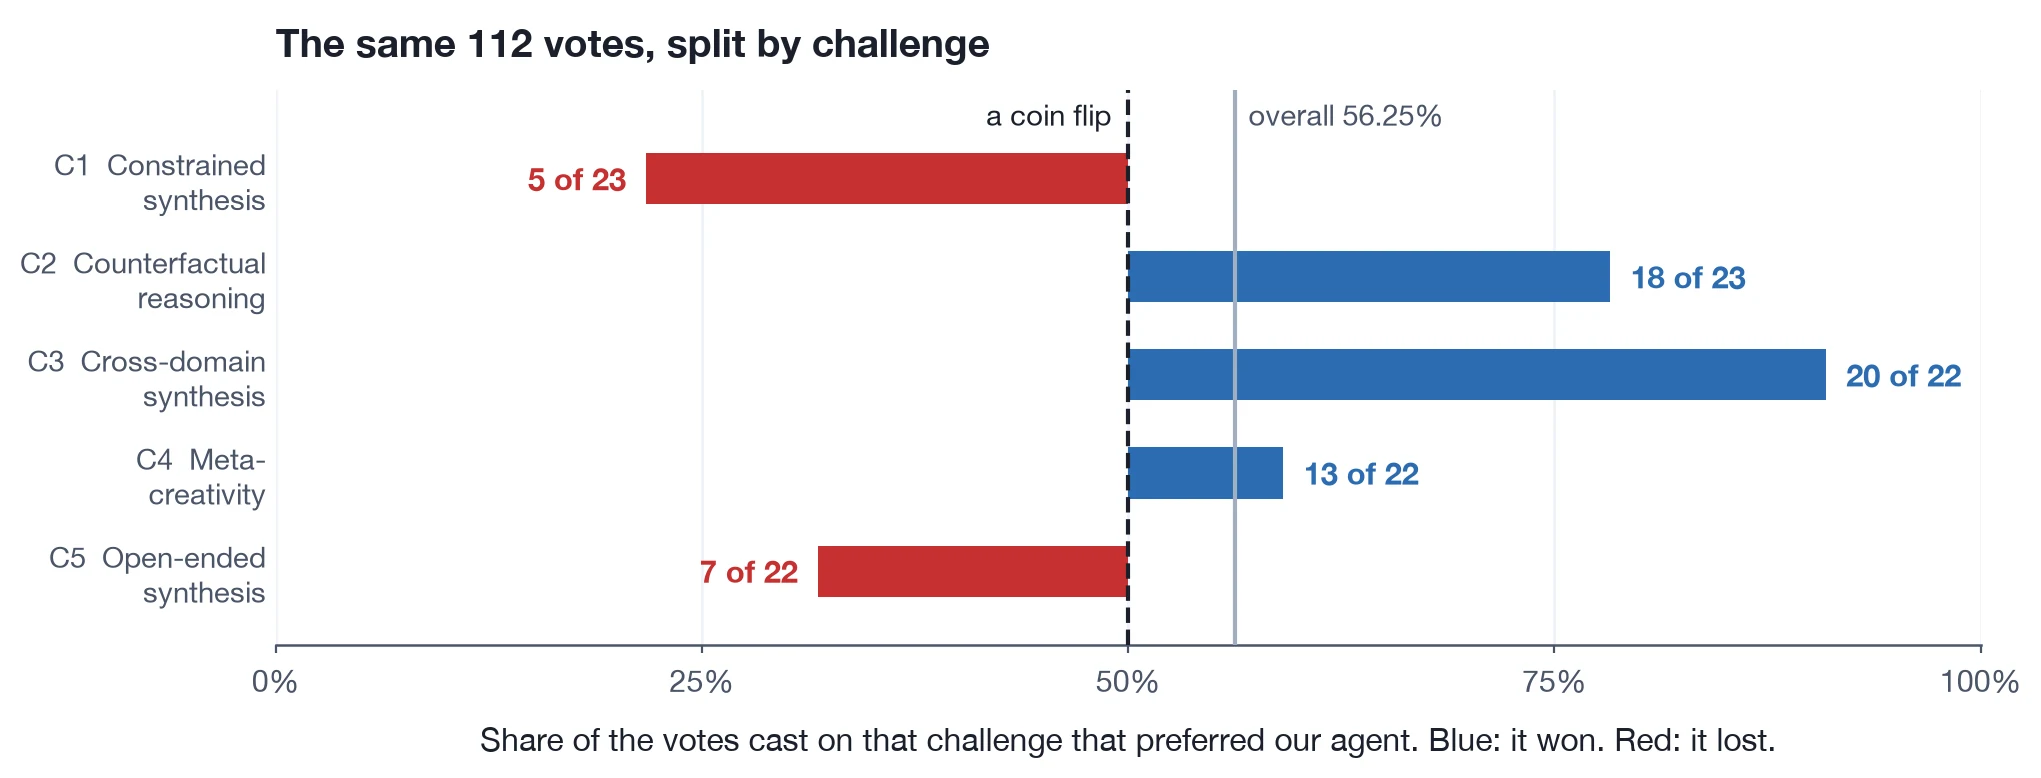
Our agent took three and lost two, and only one, meta-creativity at 13 votes to 9, was anywhere near even. On the automated evaluation it was ahead on all five.
Our paper says this per-challenge pattern “mirrors the LLM judge results.” It mirrors at the ends: cross-domain synthesis is the machine’s largest lead and the people’s most lopsided one, and open-ended synthesis is the machine’s narrowest win and one of the two the people gave away. It does not mirror elsewhere: constrained synthesis is the machine’s second-largest lead of the five, +3.33 points, and the people went better than three to one the other way.
“Mirrors” is a stronger word than the data supports, and we should have caught it before it went into the paper.
Both numbers are real
The temptation is to pick one: either the AI judges were inflated, or the humans were noisy and the real signal is in the repeated machine scoring. Neither reading survives contact with the details. The two measurements are asking different questions.
The AI judges scored each answer as written, in full, one dimension at a time against a written rubric: five challenges, scored three times over by each of three judges, 45 numbers per system per format. That is a scoring task, the kind of thing a tireless, literal-minded reader does well.
The humans saw something else: six sentences a side, the core idea restated by another model. A deliberate and defensible design, and it changes what the number can mean: everything it removes (structure, citations, the evidence laid under each claim, the breadth of what got covered) was in front of the AI judges and not in front of the people.
Whether that material is what the AI judges were rewarding is a further step this data will not carry us to. The rubric does not ask about citations or coverage; it asks how rare the idea is, how workable, and how far from the obvious. Our verbosity check points the same way: among the deep-research systems, the correlation between answer length and judge score is weakly negative, r = -0.13. Even so, “our agent’s advantage lived in the material the normalization stripped out” is a hypothesis we find plausible and did not test.
A second, smaller reason to expect divergence. “Which of these two is better” is a coarser instrument than “rate each of these on three axes from 1 to 10,” repeated across judges and trials: a win rate records how often raters preferred an answer and never by how much, so it cannot report a large margin even where one exists.
What we take from the gap is that the advantage is narrower and less uniform than the rubric totals suggest. Those three points on a 30-point scale do not survive compression to the core idea, and on two of the five challenges the compressed idea lost outright. Whether the advantage was partly in the surrounding answer, or was never as large as the rubric said, this study cannot separate, and we would not want to guess in public.
Why we published the smaller number
Our paper reports the human study as corroborating the automated findings; that word needs pinning down. 56.25% is a genuine majority in the same direction as the machine verdict, so in aggregate it corroborates the sign. It does not corroborate the magnitude, and challenge by challenge it does not always corroborate the sign either.
It would have been easy to report only that it came out in our favour. We published the number rather than the adjective because the gap is the most informative thing we measured.
The exchange rate
The field adopted LLM judges because human evaluation is slow and expensive. That trade is often correct. But the exchange rate is not one-to-one, nor constant.
Ours, on this task: a decisive automated margin on full answers corresponds to a 56% human preference on normalized summaries, and that 56% is an average over five challenges that individually ran from 91% down to 22%.
We do not know whether that ratio holds anywhere else, and would not assume so. But if you are reporting LLM-judge margins without ever having measured your own exchange rate, you do not currently know what your numbers mean.