Caesar, the research agent I work on, explores by building a map. Each page it visits becomes a node; each link it decides to follow becomes an edge. It writes its notes against that structure, and the map is what it reasons over.
A step, throughout this post, is one turn of that loop: open one page, read it, choose the next link. So a thousand-step run is a thousand page-opens, not a thousand distinct pages. Most of what follows turns on that distinction.
Somewhere along the way the system started saving a snapshot of that map every 50 steps. It was debugging instrumentation, originally. Those snapshots accumulated quietly: 2,382 of them, across 102 runs, sitting on disk. As far as I can tell nobody had ever looked at them as a dataset.
Two details, since I am quoting a count. There are 2,387 files, but five snapshots are stored twice, plain and gzipped, so 2,382 is the number of distinct snapshots. And the 50-step interval covers 88 of the 102 runs: a batch of older ones wrote every 10 steps, and one wrote every 5.
Only 80 of the 102 runs get all the way to step 1,000, and 77 of those are on the 50-step interval. Those 77 are the comparison set below, so that a run is never called early or late on the strength of a finer snapshot spacing.
Nearly half the steps are revisits
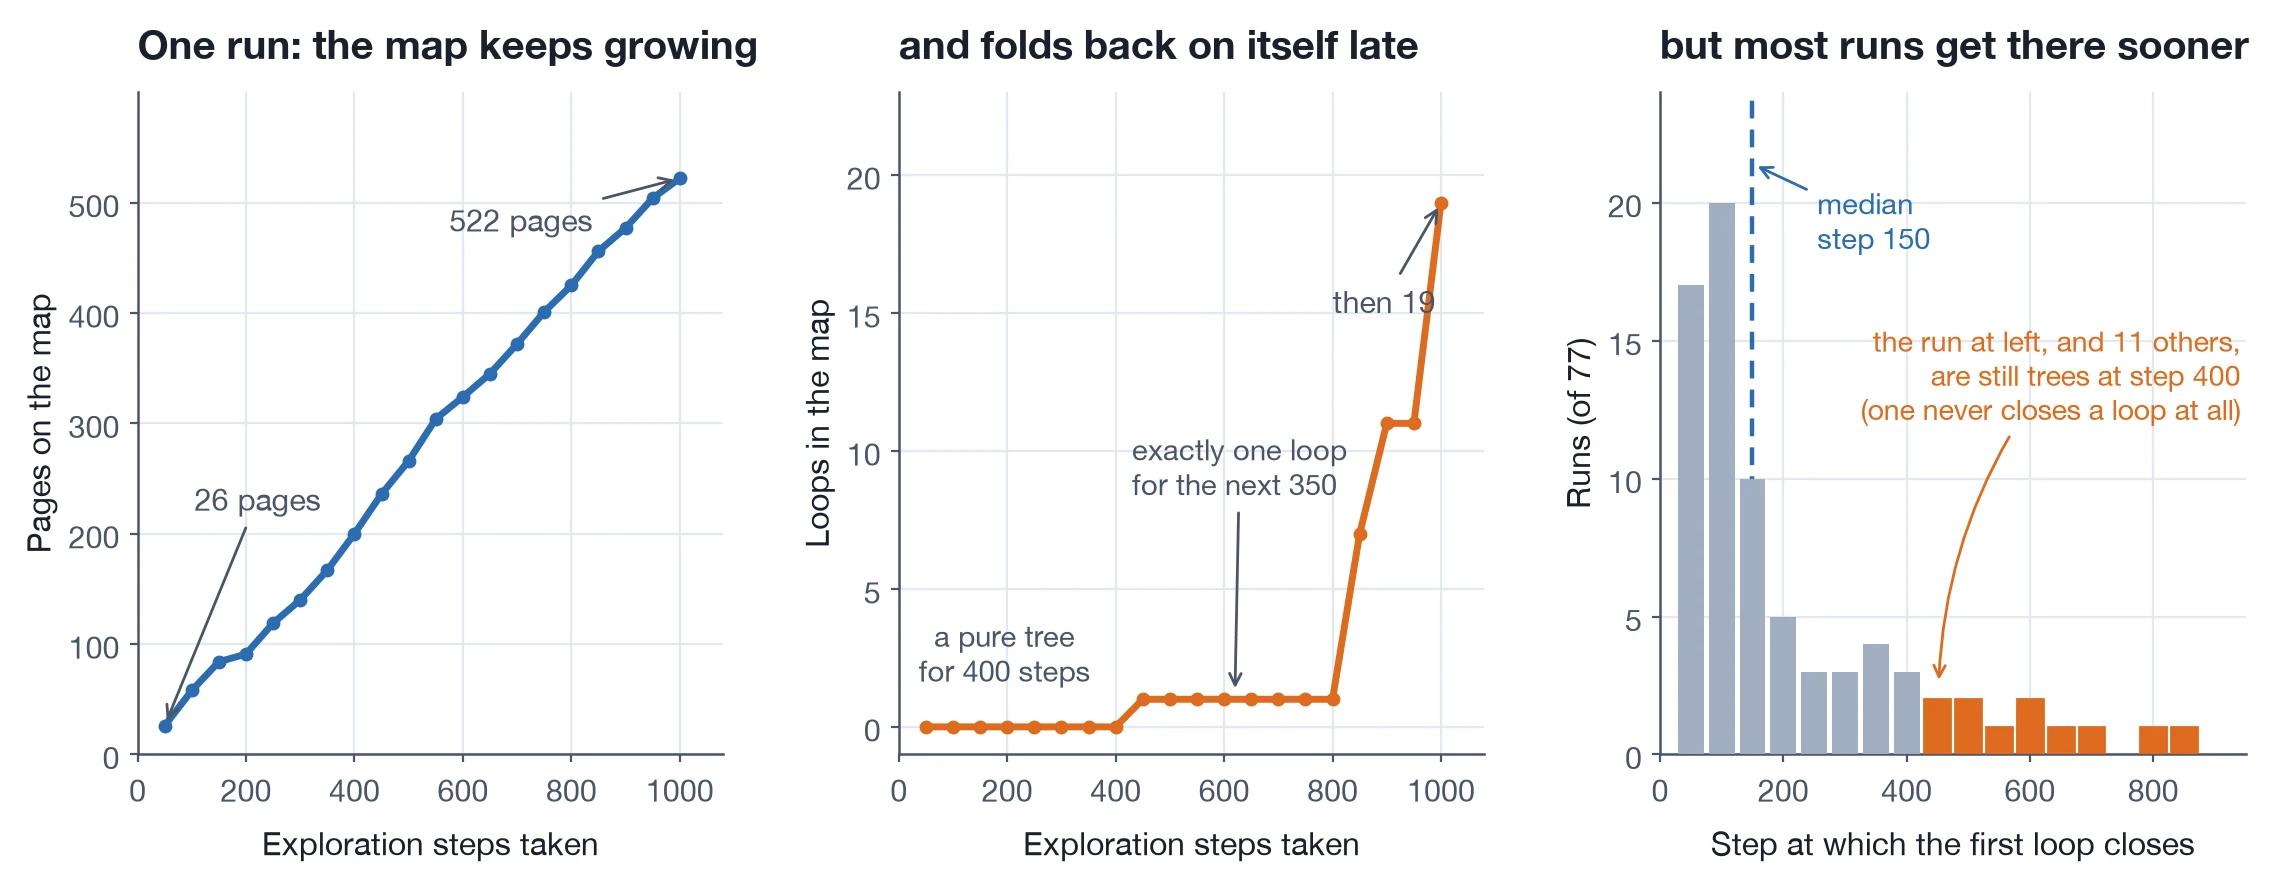
Take the 1,000-step run in the figure below, on a constrained-synthesis prompt: invent an emotion humans do not have. At step 50 the map has 26 nodes. At step 1,000 it has 522. Other runs go further; the largest of the 77 reaches 941.
Over a thousand steps, then, that run added roughly five hundred pages. The rest of the time it was moving to somewhere it had already been. Every node carries a visit counter, so revisits are countable rather than inferred: across the 77 runs, the median one spent about 44% of its steps opening a page it had opened before.
My first reaction was that this is waste, and that a better policy would revisit less. I have come around to thinking that is wrong. Revisiting is how backtracking works. To abandon an exhausted branch and pick up a promising one from earlier, you have to walk back through territory you have already covered. A crawler that never returns anywhere is not being efficient; it is being unable to change its mind.
What I wanted to say next was that each exploration finds a characteristic pace early and keeps it: steady within a run, varying a lot between runs. The snapshots do not support it. Cut every run into its 50-step intervals and the discovery rate wobbles about as much inside a single run as it does across runs (median within-run coefficient of variation 0.23, against 0.23 for the run averages), and only about a third of the variance in that rate is between-run. The growth curve below looks smooth because it is cumulative.
When it stops being a tree
The measurement I like best is the simplest.
Count the loops in the map. Treat every edge as undirected and count independent cycles, which is edges minus nodes plus connected components: the number of edges you would have to cut to be left with a forest. Zero means every page was reached exactly one way. The components term is not decoration. Sixty-three of the 2,382 snapshots are not connected, and on 14 of them the shortcut version of the formula, edges minus nodes plus one, returns a negative number of loops.
In the run I plotted, the count is zero for the first 400 steps. The map is a pure tree, the agent fanning outward without ever closing a loop.
Then one loop appears, and for the next 350 steps there is still exactly one. The count only breaks open in the last fifth of the run, going 1, 7, 11, 11, 19 over the final two hundred steps. Across the 77 runs the end-of-run count ranges from 0 to 126.
Then I plotted the other 76, and 400 steps turned out to be the tail rather than the rule. The median run closes its first loop at step 150, not 400. Thirty-seven of the 77 have closed one inside their first 100 steps. Only 12 are still trees at step 400, and exactly one never closes a loop at all in a thousand steps. The run I plotted is in that slow tail, and part of why is the question it was given: constrained-synthesis runs are the slowest as a group, median first loop at step 225, against step 100 for open-ended ones.
The late explosion is a property of this run too, more than of the set. For the median run, 40% of the final loop count is already in place by step 500 and 76% by step 800; only 10 of the 77 take more than half their loops in the last fifth.
A cycle means two independent lines of inquiry converged on the same source. In a tree the structure is a record of where the agent went. Once cycles appear, the structure starts encoding something about the territory: that these two apparently separate threads are actually connected.
That transition, from tree to graph, is the point where the map stops being a travel log and starts being a model. Nearly every run makes it: 76 of the 77, somewhere between step 50 and step 850. What varies, by more than an order of magnitude, is when.
Depth comes in two bursts, not one
Depth, in these snapshots, is how many links a page sits from the starting page, counted along the route the agent first took to it rather than the shortest one. The same run commits to one line and pushes it to a depth of 23 within the first 150 steps. Then it stops going deeper for 250 steps and widens instead. Then it descends a second time, to 26 by step 450 and 31 by step 500, and after that the deepest point on the map never moves again for the remaining half of the run.
Nobody designed that schedule; the policy chooses step by step from local structure. I had been describing it to myself as depth first, then breadth, which the first 400 steps support and the second descent does not. What the snapshots actually show is two bursts of descent with a plateau between them, and then five hundred steps in which the frontier only gets wider.
The flat second half is this run’s habit rather than the system’s. The median run does take most of its depth early, 87% of its final depth by step 500, but 48 of the 77 go deeper after that, and among those the median gain is another 36 levels. This run is also a shallow one: it bottoms out at 31, against a median of 84.
Open-ended sprawls, constrained stays tree-like
Different question types produce visibly different maps, though only part of what I first said about them survives a recount. Across the 60 of those 77 runs that carry one of five question types, twelve apiece, open-ended questions sprawl clearly the furthest: a median of 678 pages, against 531 to 544 for constrained synthesis, cross-domain synthesis, meta-creativity and counterfactual reasoning, which are not distinguishable from each other. So the size contrast is not constrained against open-ended, it is open-ended against everything else.
Interconnection is where constrained questions separate out. They end with 0.023 cycles per page, the lowest of the five types, against 0.043 for cross-domain and 0.042 for counterfactual questions, with meta-creativity on 0.033 and open-ended on 0.036 in between. A tightly constrained question produces a map about the same size as the others and a much more tree-like one.
What I originally wrote here was that constrained questions produce the smallest graphs and cross-domain ones sprawl the furthest. Neither holds. The first was reading a three-page difference in a median as a result, and on the second the cross-domain median of 534 sits with constrained’s 531, well below open-ended’s 678.
The mildly embarrassing part
These snapshots were a debugging artifact: written, rotated, ignored, for months before anyone plotted them. The behaviour they describe is one of the more interesting things our system does, and it was sitting in a results directory the entire time.
I suspect this is common. Instrumentation gets added to answer a specific question, answers it, and then keeps running. If your system has been logging structure for a while, it is worth an afternoon to ask what the logs would say if you treated them as data rather than exhaust.
The second afternoon is the one that costs you the title. I plotted one run, found something clean, and wrote it up as a fact about the system before plotting the other 76. Half of what I had was a fact about a run.
Our logs said: about 44% of the steps are revisits; the map is a pure tree for the first 150 steps of a median run, and for 400 in the run I happened to pick; and most of the depth arrives in the first half, though most runs are still finding more in the second.